
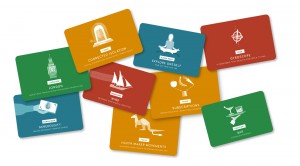
MethodKit is an analogue tool for meetings and workshops or individual idea development. The kits are flexible frameworks where each card represents a different perspective [footnote]Examples could be: goals, team, budget, roles & responsibilities.[/footnote]. More about what MethodKit is.
There are no rules or right amount of players for the MethodKit decks. Arrange the cards to define and structure your thoughts around them. Use them for discussing, planning and organizing. They are building-blocks that create visual overview of your project, to realize what needs to be prioritized and what is missing. They are used for idea development, coaching sessions, client meetings, in workshops and to facilitate meetings.
Some common ways to use the kits
Sort and define scope
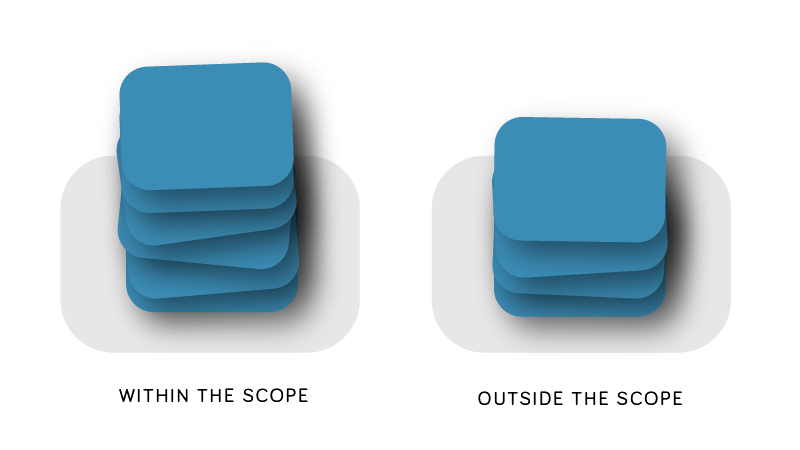
Sort the cards in two different stacks to understand the scope of the project.
Prioritize with your team
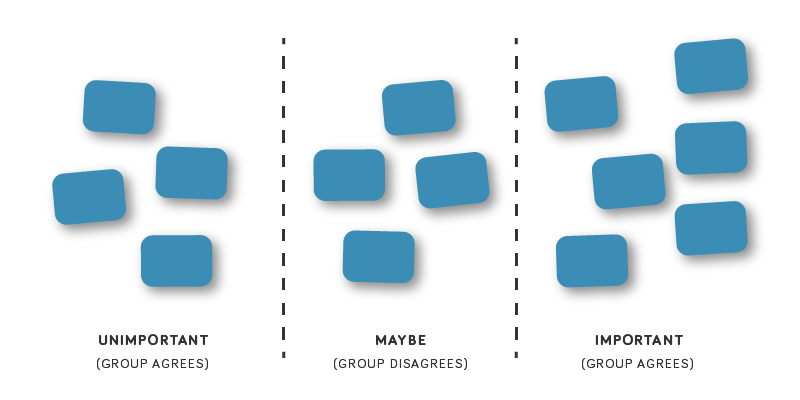
Discuss the importance of different things. Place the cards you don’t agree on in-between the unimportant and important group.
Post-it clusters
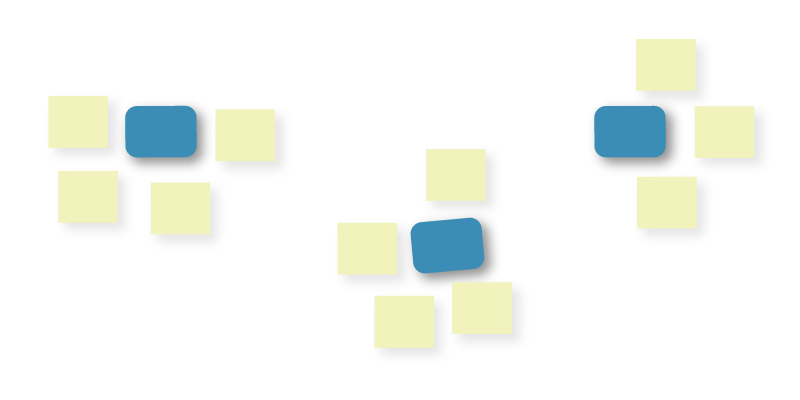
Use post-it notes to cluster your ideas around different cards on a table, wall or whiteboard. Discuss how they relate to each other, draw arrows or place them accordingly, in a mind-map fashion.
Analogue Trello Board
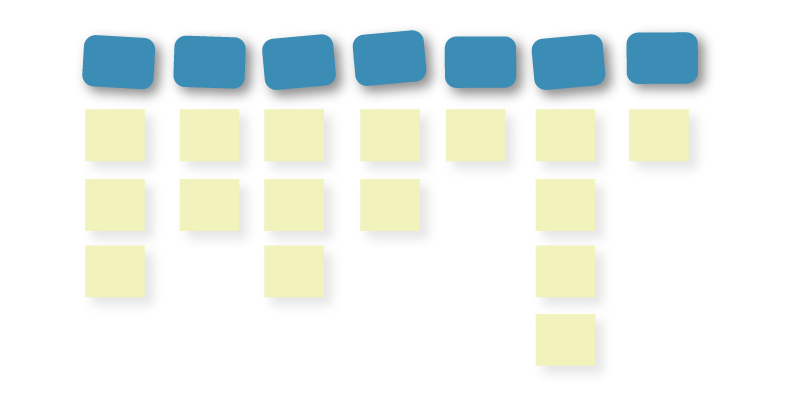
Use the cards as headlines for sorting your thoughts and ideas.
Pick and discuss
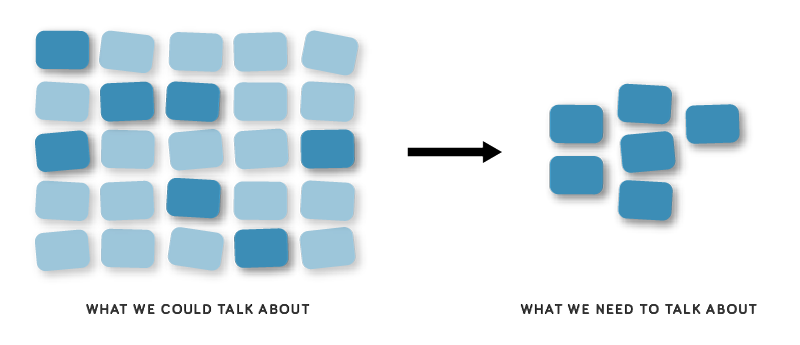
Place the cards where you can see them all. Decide which ones are important. Groups can let everyone pick a card to the “What we need to talk about”-selection.
Timeline
(1 axis-grid)
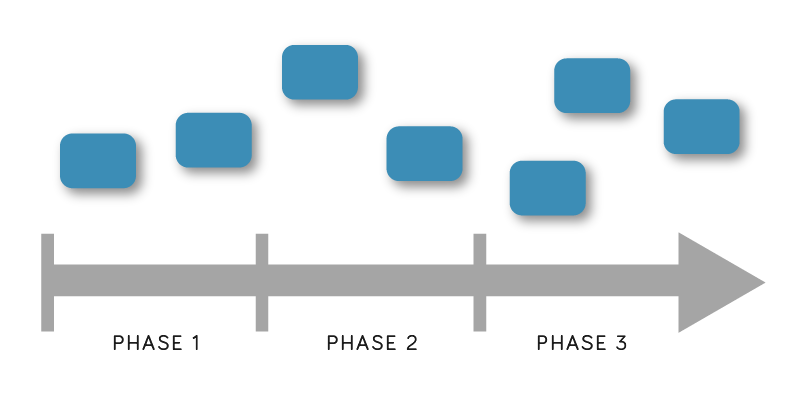
Decide when to do what by arranging selected cards on a timeline.
Selection Grid
(2 axis-grid)
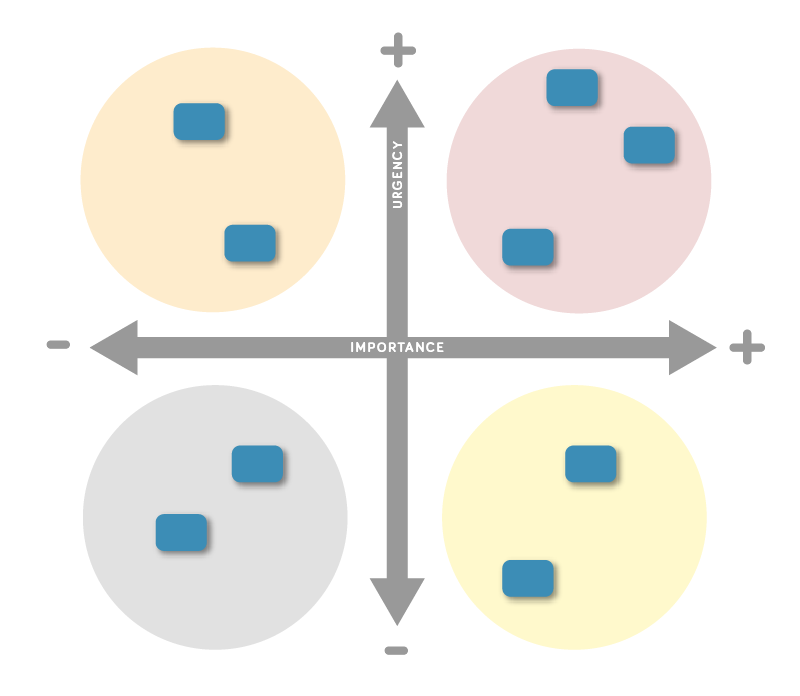
Prioritize tasks and parts of projects by assessing importance (x) and urgency (y). The grid gives you a visual overview of what needs to be done.
Detailed Examples
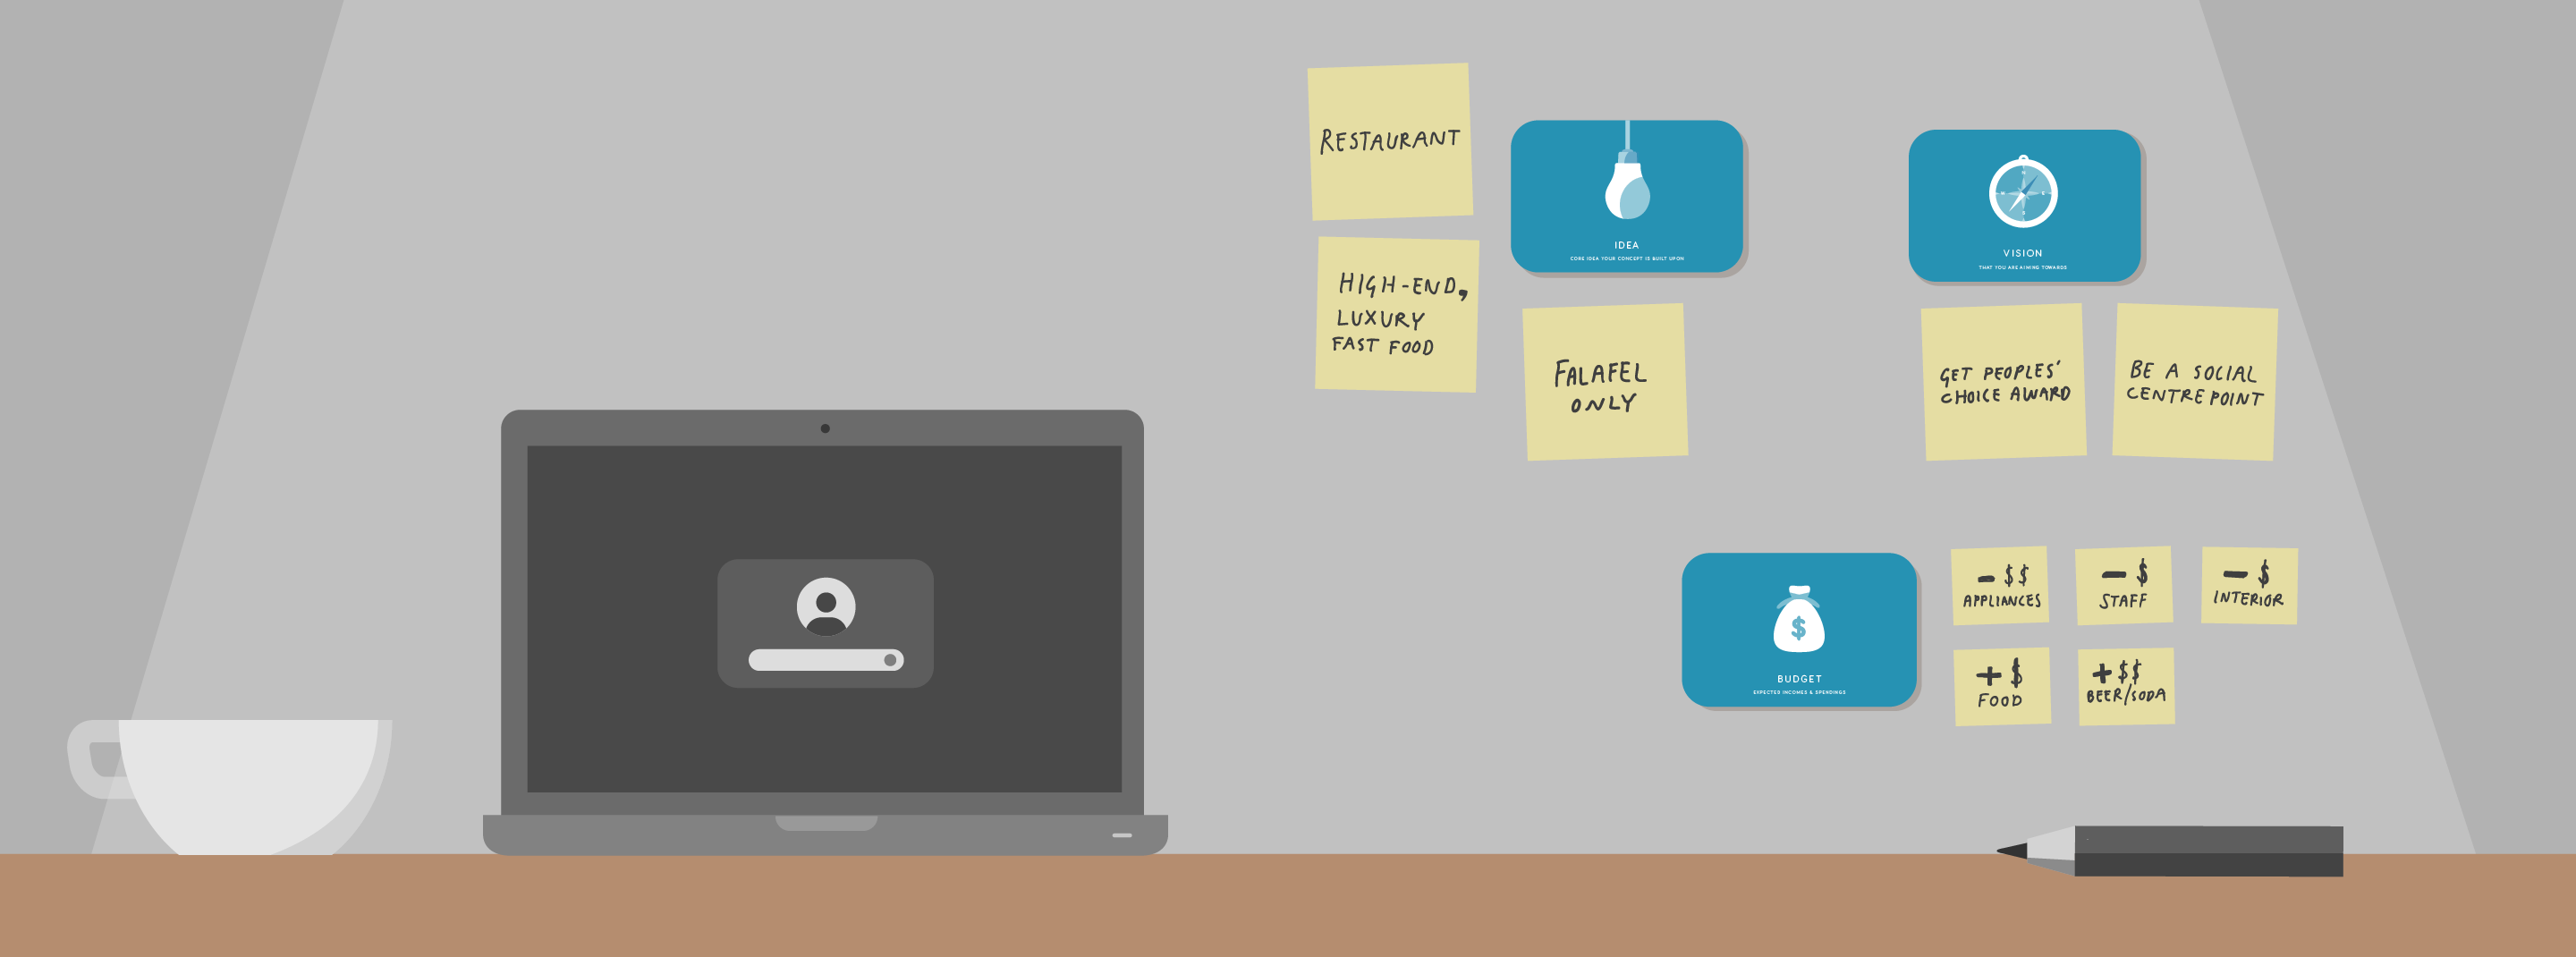
Cluster on wall
- Pick a few cards/aspects that you need to define better in your project or startup.
- Stick them to the wall using tape or sticky mass (Blu-Tack).
- Map post-its around them with one-line descriptions of your thoughts.
- Look at them every now and then and write up new things as you come up with new ideas.
Project Grid
Use the cards as the headlines in a grid. Use it to overview your projects and write down one-line explanations that define different parts of the projects as you come up with them.
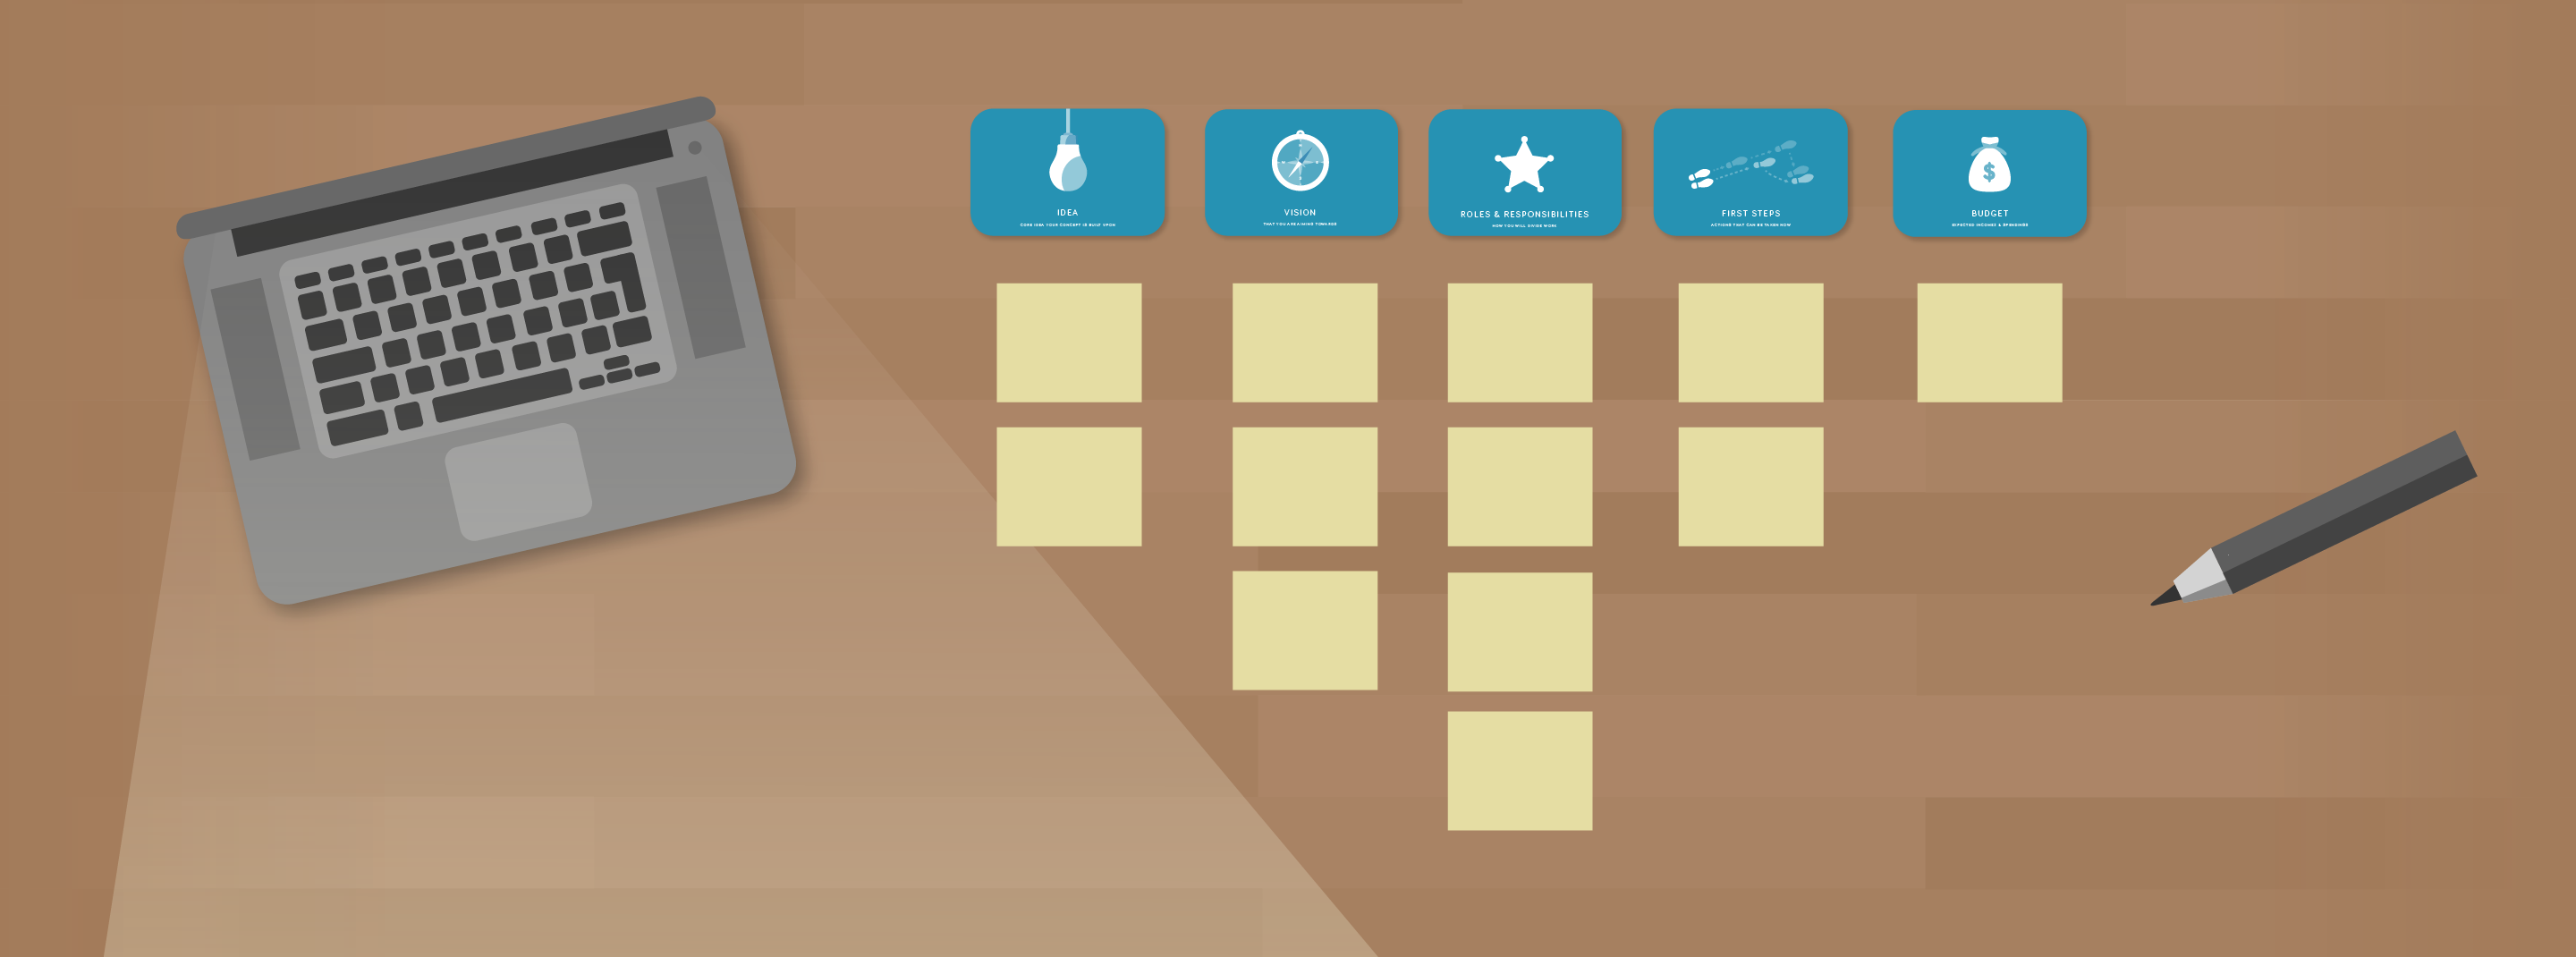
- Each column represents an aspect you need to define (or that is already defined).
Table Cluster
Pick a few cards/aspects that seems relevant for now. (Elevator Pitch, Differentiator and Value are selected to describe MethodKit above.) Map post-its around them with one-line explanations.
The Wall
The Wall is a workshop exercise that can be use with the different kits to map definitions and differences in opinions in a group.
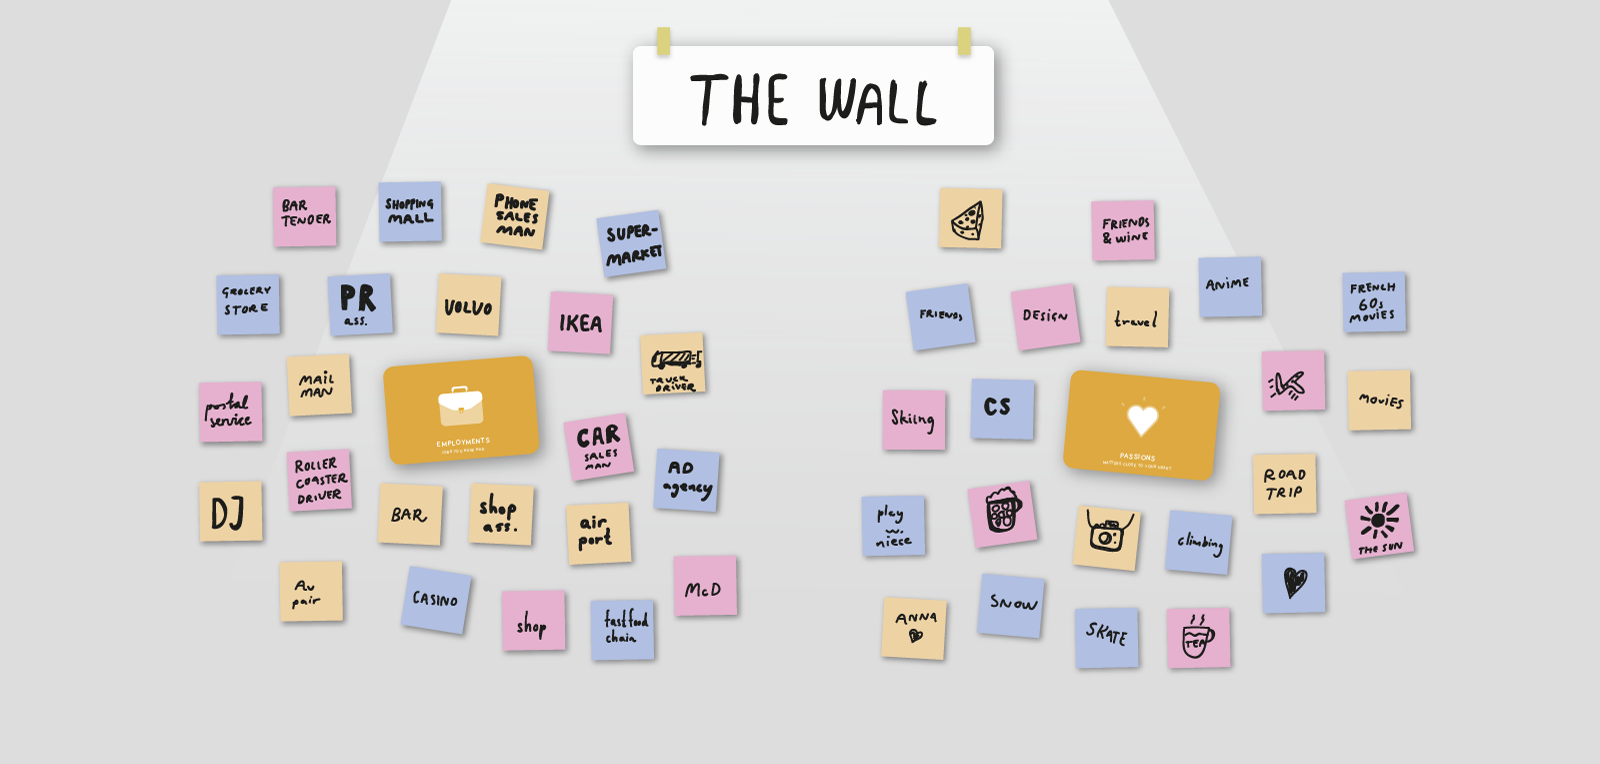
For example, the Personal Development-cards can be used to visualize diversity within a group. The picture shows a group where people wrote down different employments they had in their lives and what their passions are. Often groups have a tendency to stagnate and stop exploring each other. The exercise helps to show possible stings which have not been pulled yet.
Working with the Projects or Startup kits, the wall can help you to map and define your project. The overview can then be used as a summary to write project proposals and descriptions, or to initiate discussions on which definitions, strategies and solutions you agree or disagree on within the group.
Timeline and spectrum
Use scotch tape (paper tape) on walls to create a timeline. Place the cards to the get an overview of where you are in the process and what to do next.
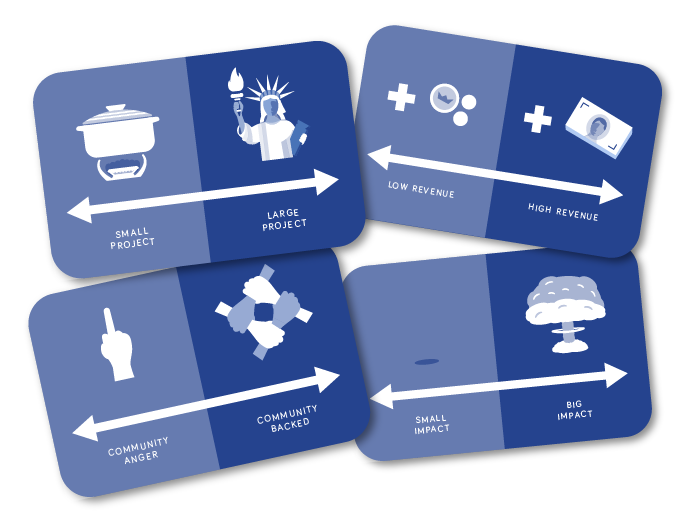
A spectrum is a one dimensional way to assess ideas and concepts. Arrange the cards on a scale between two extreme points.
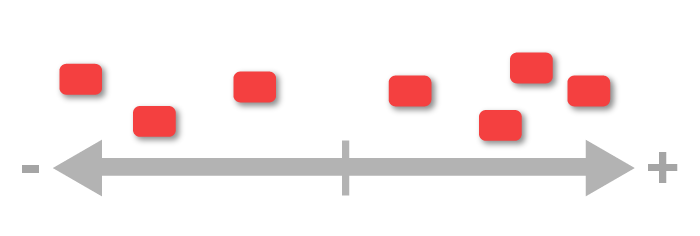
Examples of spectra
- Is the idea easy/hard to carry out?
- Would it be boring/fun?
- Would the process be slow/fast?
- Do you need many/few people to realize the idea?
Two stacks
The two stacks is the classic way of selecting ideas. Ideas fall in either one of the stacks, depending on the chosen criteria. It is a binary, black and white way to assessing ideas.
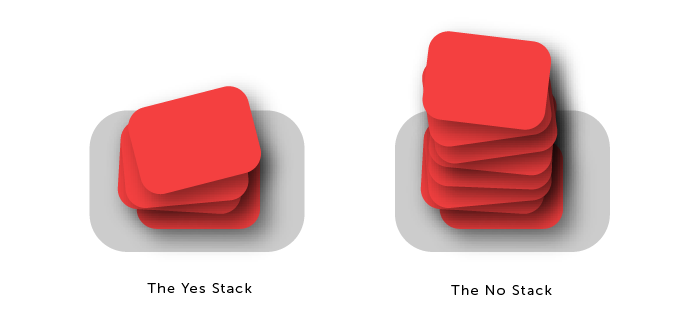
Examples of stack pairs
Yes OR no
Fast OR slow
Denied OR approved
Irrelevant OR relevant
For more possibilities check the example on how to construct grids below.
Selection Grids
Use scotch tape on walls to create selection matrixes and grids. The result depends on which opposites you choose to work with. Then add cards or ideas on post-its to the matrix to be able to select and evaluate.
To be able to create good stacks, spectra and selection matrix grids, opposing concepts come greatly in hand. We made MethodKit with Selection Criteria for this.
OPPOSITES
Complicated — simple
Expensive — affordable
Strengths — weaknesses
Expected — unexpected
Loss — Gain
Static — adaptive
Violent — peaceful
Draining — energizing
Unstructured — structured
Homogene — diverse
Ugly — beautiful
Within the norms — breaking the norms
DEGREE OF ONE WORD
Project scale: Small project — large project
Capacity: Small capacity — large capacity
Impact: Small impact — big impact
Workforce need: Large workforce — small workforce
Expenses: High expenses — low expenses
Revenue: Low revenue — high revenue
Margins: Low margin — high margin
Challenges: Many challenges — Few challenges
Usability: Hard to use — easy to use
Scalability: Not scalable — scalable
Loyalty: soft (choice) or hard (contract)
Profitability: Unprofitable — Profitable
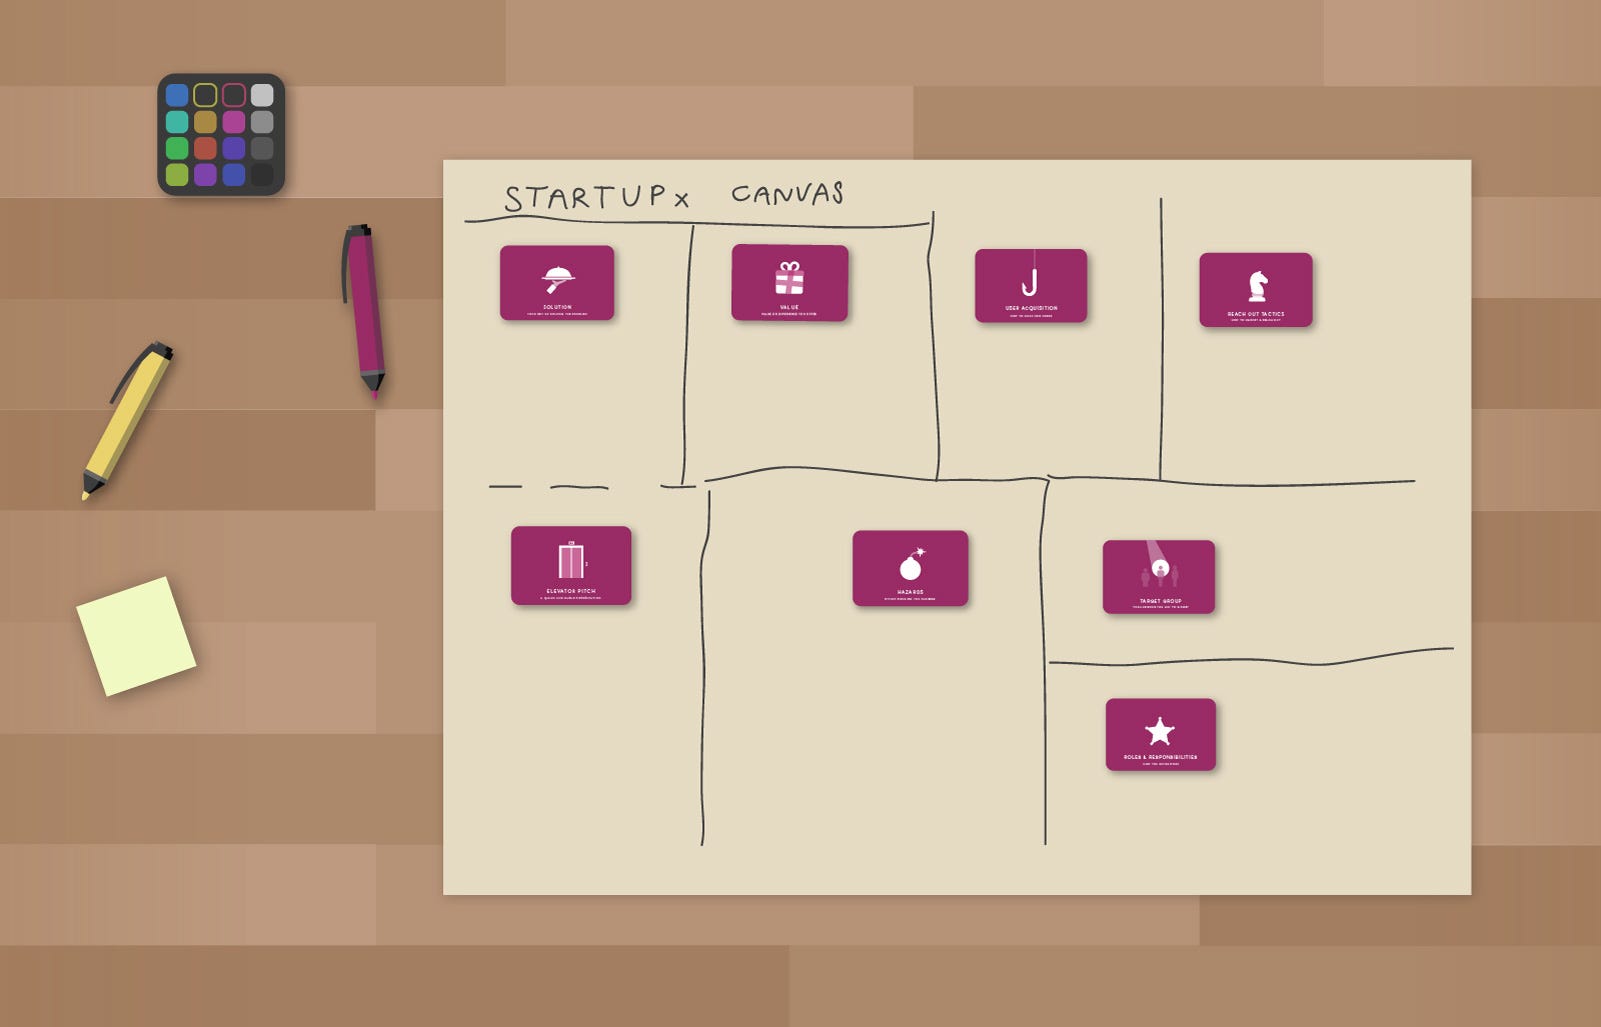
Make your own canvas
Do you like our Business Model Canvas? Use the cards to create a canvas tailor-made for your project.
- Bring a big paper (A2-A1)
- Pick 5–10 cards/aspect. (For the illustrated example we picked Solutions, Value, User Acquisition, Reach out tactics, Elevator Pitch, Hazards, Target Group and Roles/Responsibilities)
- Attach them to the canvas paper.
- Start defining and taking notes to define your venture.
A fixed framework like business model canvas only shows a fixed path of defining business models. This can sometimes be helpful but we believe it is better to adapt things based on each project or situation.
Create Personas
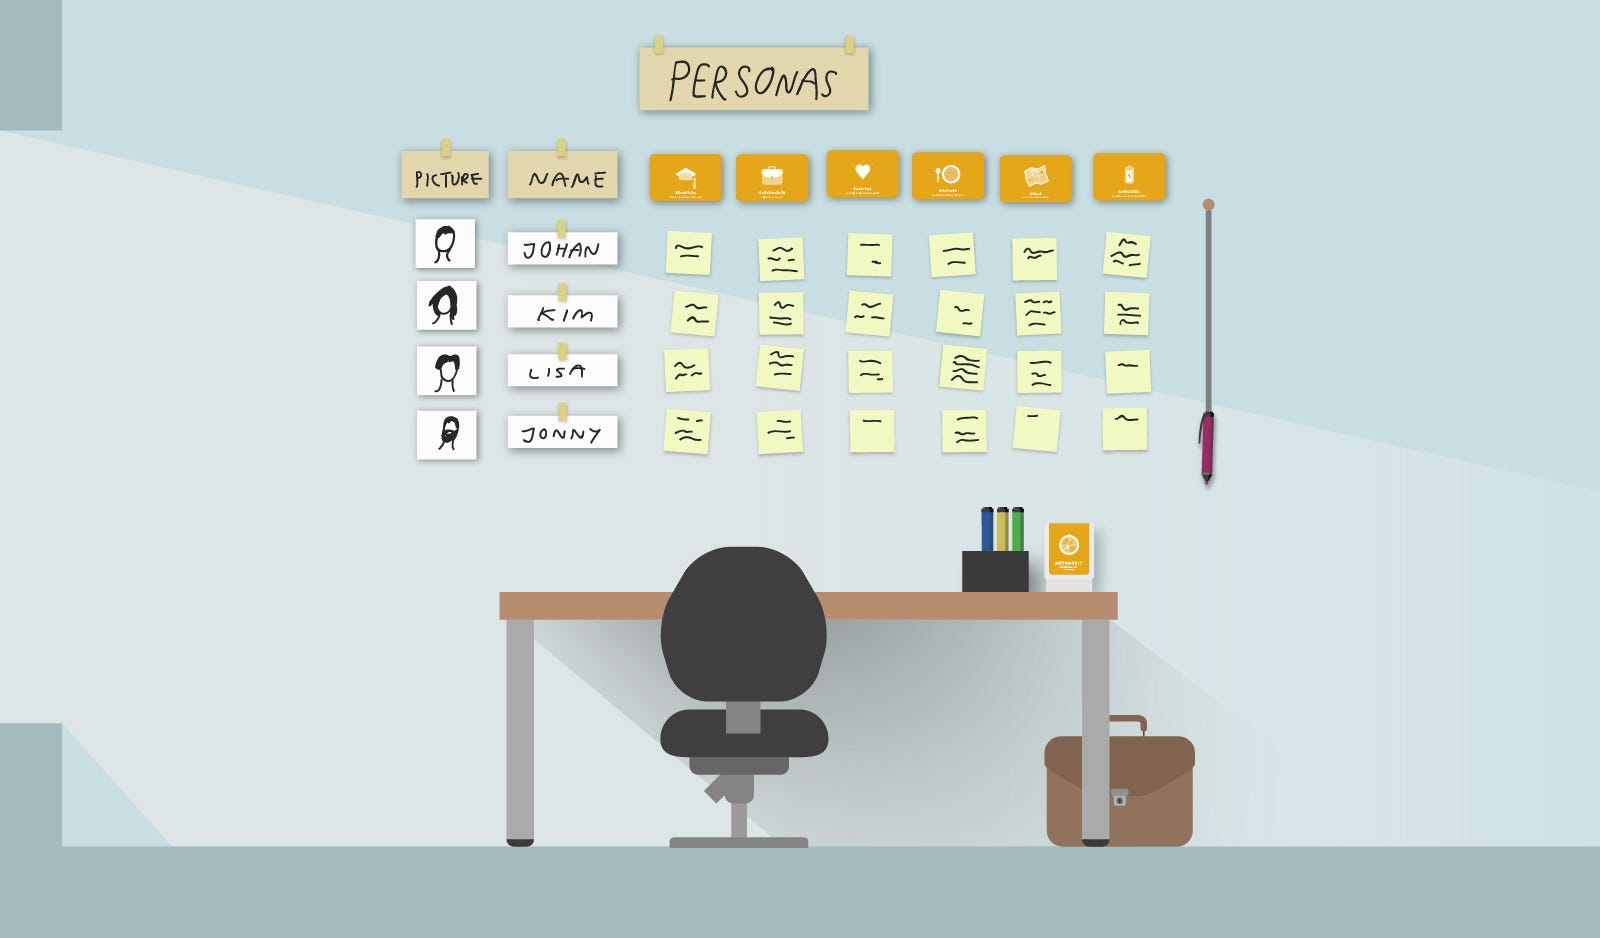
Use cards from MethodKit for Personal Development to map different Personas. It could be personas from your target group or characters from your upcoming book/action movie.
Cards used in the example: Education, Employments, Passions, Routines, Goals, Energizers.
Create a personal inventory
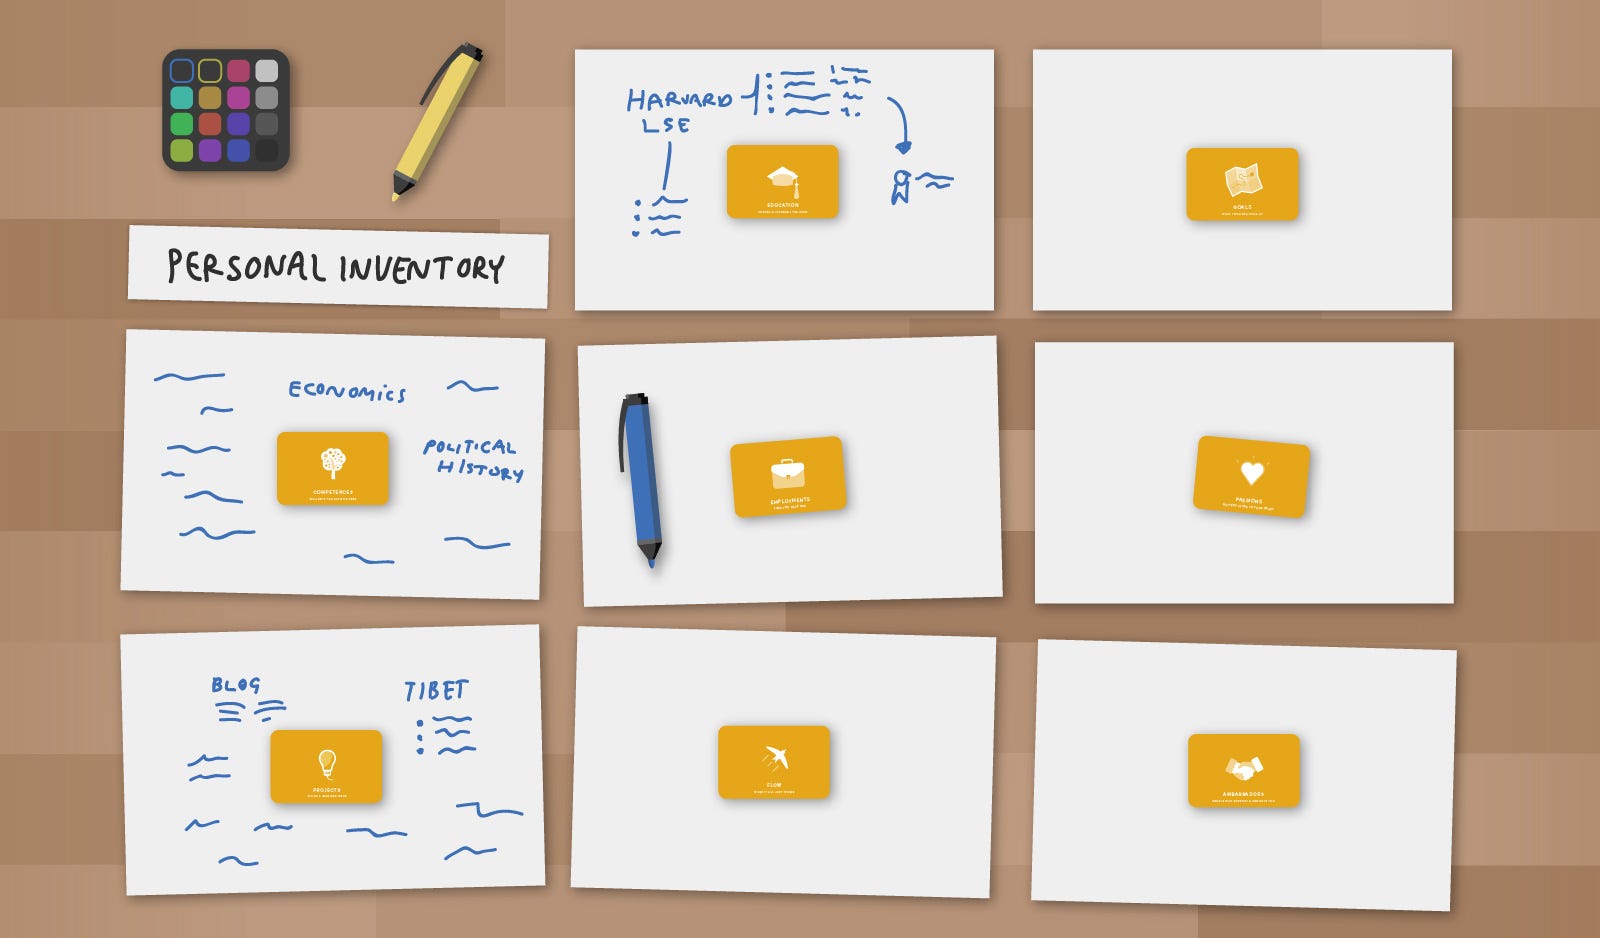
Take an afternoon or weekend away from the computer to make a personal/professional inventory using MethodKit for Personal Development. Put different aspects onto A4 papers (or letter size). Write down things that come up.
The inventory could be a plan for the future and/or a collection of raw data to use in a job application or CV. We very seldom take time to get overview of the details in our lives, but when we see everything we know written down, our experience is that most people get new insights by connecting and seeing patterns.
The inventory could contain cards like Competences, Projects, Education and Employments, as well as more philosophical ones like Passions and Flow. For the purpose, we also recommend the cards that can be used for defining goals, such as Measurable goals, Success factors and Vision.
Another interesting part of your own inventory is the network around you, where you map for example friends, relationships, gatekeepers and ambassadors.
Good additional tools
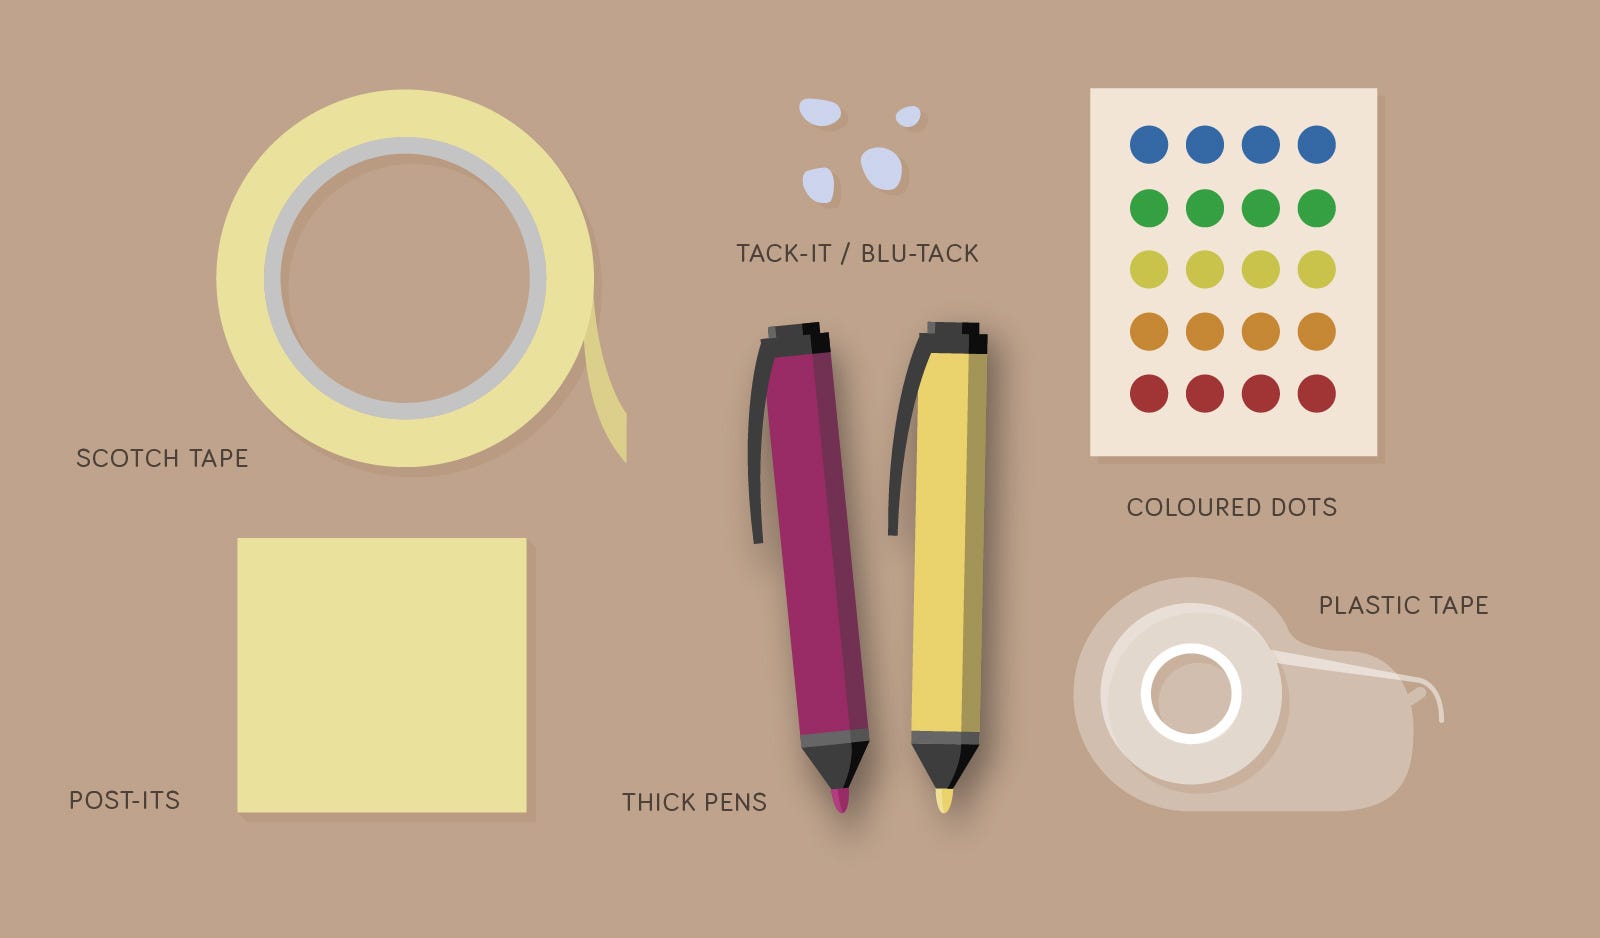
Scotch tape
Create grids and selection matrixes on walls.
Post-its
Put definitions of the different aspects on post-its.
Colored dots
Use dots to select the best ideas/definitions together in a group.
Thick pens
Makes overview from a distance easier.
Tack-it/Blu-Tack
Sticky mass that can be used to attach cards to walls.
Plastic Tape
Can also be used to attach the cards to walls.
Explore more examples
Expand them below:
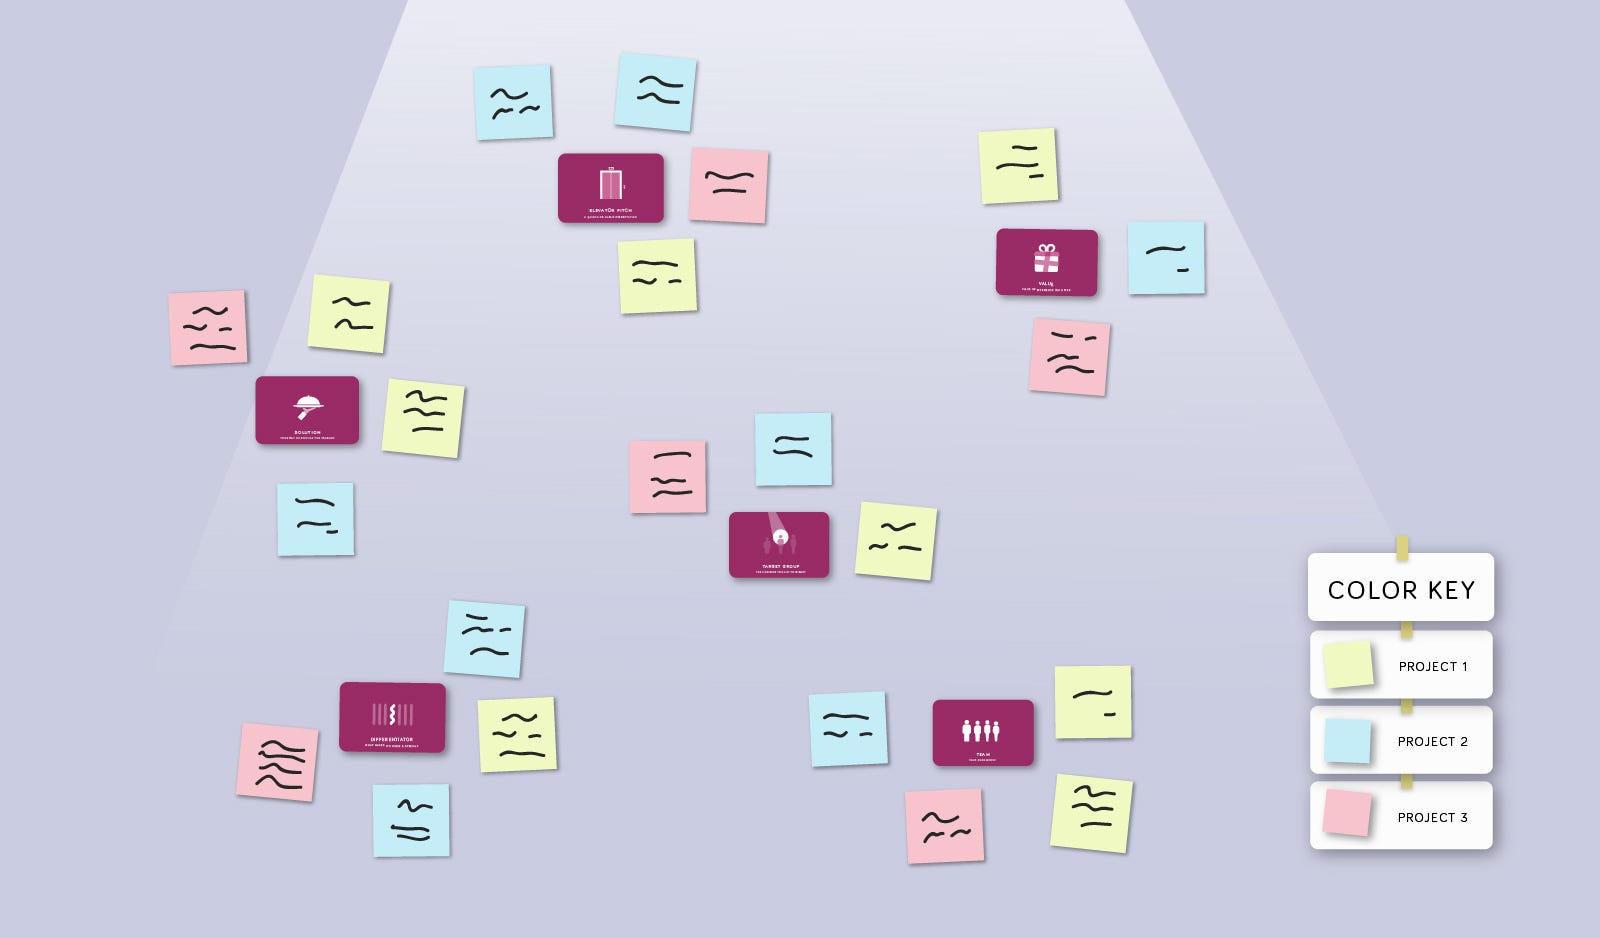
Board of multiple projects
Develop and overview many projects on the same board. Use one post-it color per project. Create a Color Key to clarify which color relate to which project.
If you work three persons side by side this can be a good way of helping each other to define and to get new perspectives of your individual projects.
Timelines and Grids
Which parts of a project are important and not?
Using importance and urgency on the two axis give you a way to understand how what is important to prioritize.
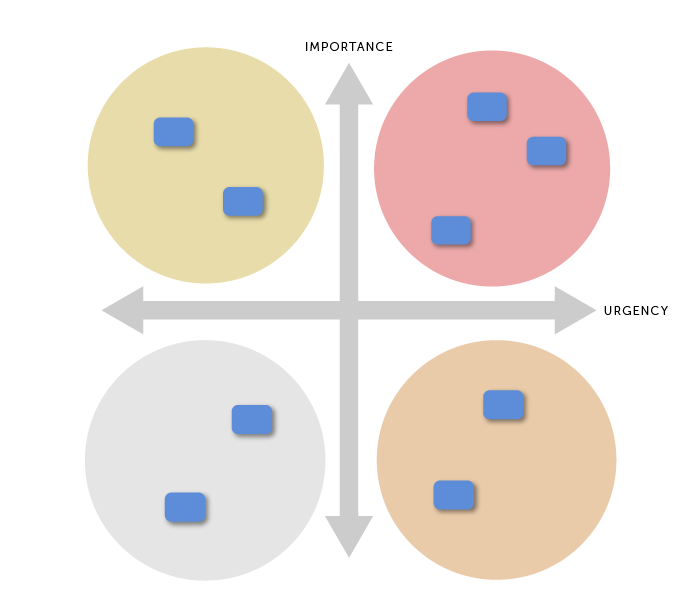
High importance +High urgency = Do ASAP (red area)
High importance +Low urgency = Plan execution (yellow area)
Low importance + High urgency = Do after the ASAP tasks or Delegate (orange area)
Low importance + Low urgency = Wait or ignore (grey area)
How trends and game-changers affect organizations
Using impact and preparedness on the two axis give you a way to understand how trends affect your organization and industry.
Impact (on industry) + (organization) preparedness.
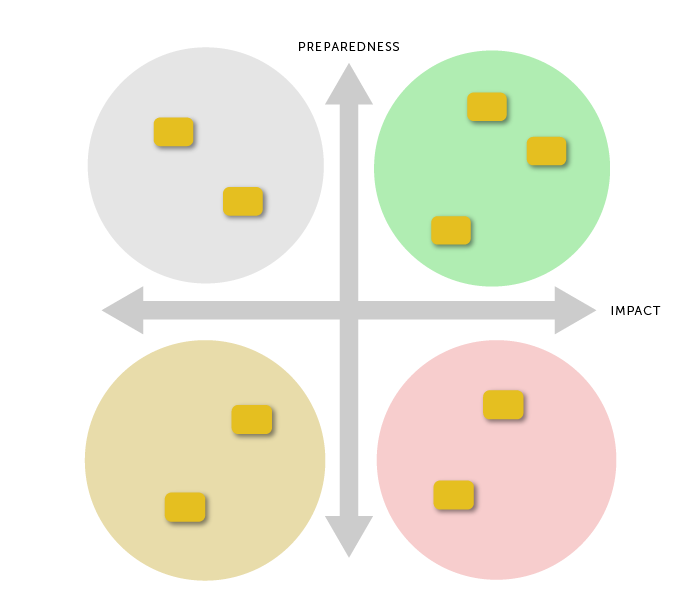
Organization Preparedness vs Industry Impact =
Organization position regarding new trends.
Green area (strengths):
High impact + High preparedness.
Red area (weaknesses):
High impact +
Low preparedness.
Yellow area (possible weaknesses):
Low impact +
Low preparedness. Grey area (Possible strengths)
Low impact + high preparedness
High impact +High preparedness = Strengths
High impact +Low preparedness = Weaknesses
Low impact + Low/high preparedness = Ignore
I suggest that you write up different trends that you have researched on different post-its or cards.
We’ve been making MethodKit with Trends, a deck of cards with 100 trends to use in this purpose.
Spider diagrams
are multidimensional ways of assessing ideas and projects.
When selecting ideas, a spider diagram can consist of multiple axes with selection criteria. Each slice of the spider diagram represent one axis. A spider diagram is an easy way to overview a complex situation.
Each slice in the diagram represents a different aspect of a project. The diagram becomes a way to assess the progress of the project.
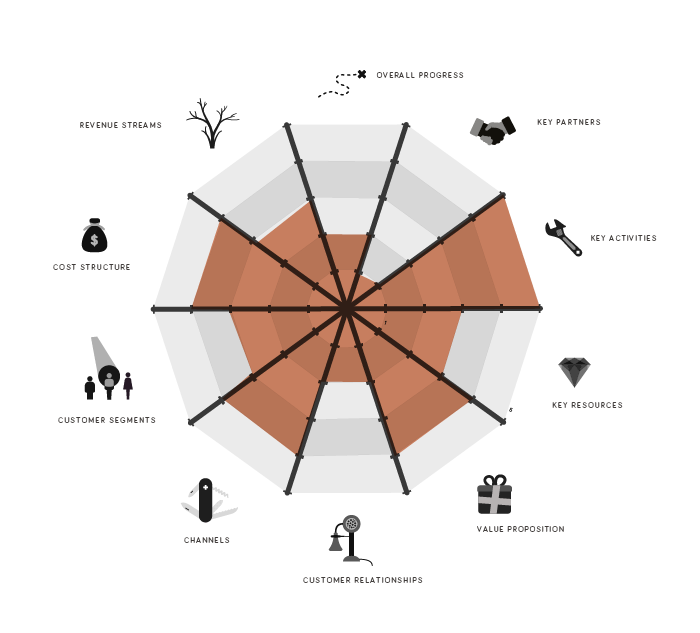
The diagram gives a framework for discussing a project in a group or assessing it yourself.
Above is an example of how Business Model Canvas would look like as a spider diagram. Each slice shows how well you have achieved within that specific area.
The diagram gives a visual and assessment of the situation. We have been using them as worksheets. PDFs free to download.
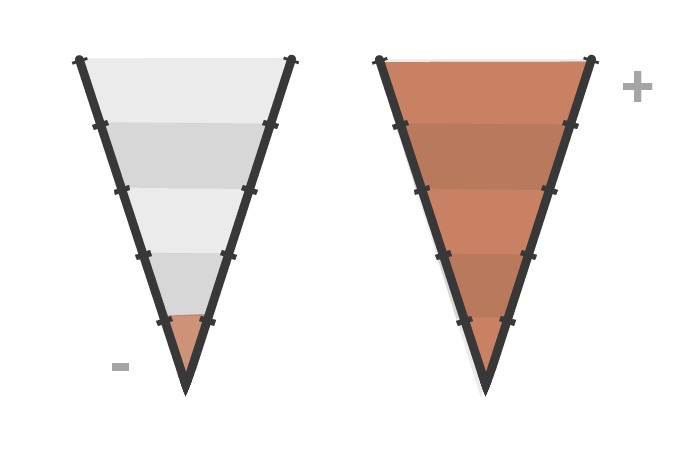
Using Spider Diagrams to understand what to focus on
A assessment of how complete different parts of a project is.
ON THE RIGHT:
The same mapping as the one to the left analyzed.
Green fields show things that are done & well crafted = Strengths
Red fields show things that lack completion or that are poorly crafted
= Weaknesses.
Using level of completeness (1–5) can give you a good idea of your strong and weak points, and how well accomplished different parts of your project are.
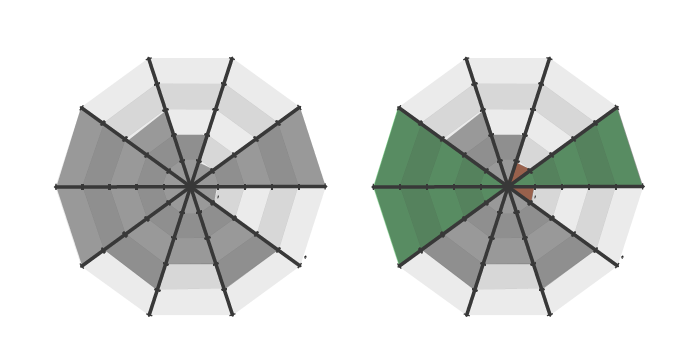
Using Spider Diagrams to unite groups
Group members start off with individual mappings of a project, then compare your assessments to identify differences in how you perceive the project (marked in red below). Discuss and try to find out why you see it differently and try to put together a common diagram.
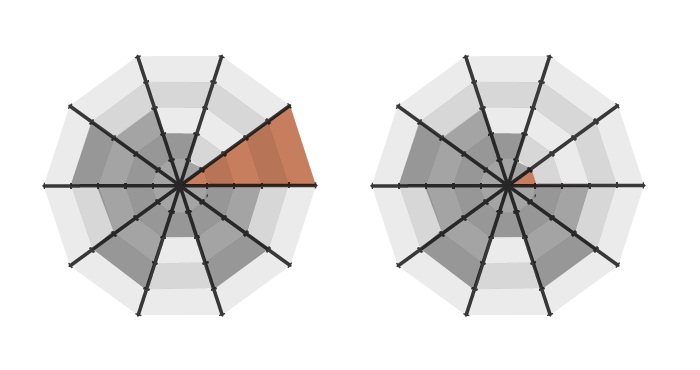
Parallel mappings
Using individual assessments of a joint project to see where you do not share the same view.
Left and Right show opposing opinions on how complete or well crafted an aspect of a project is.
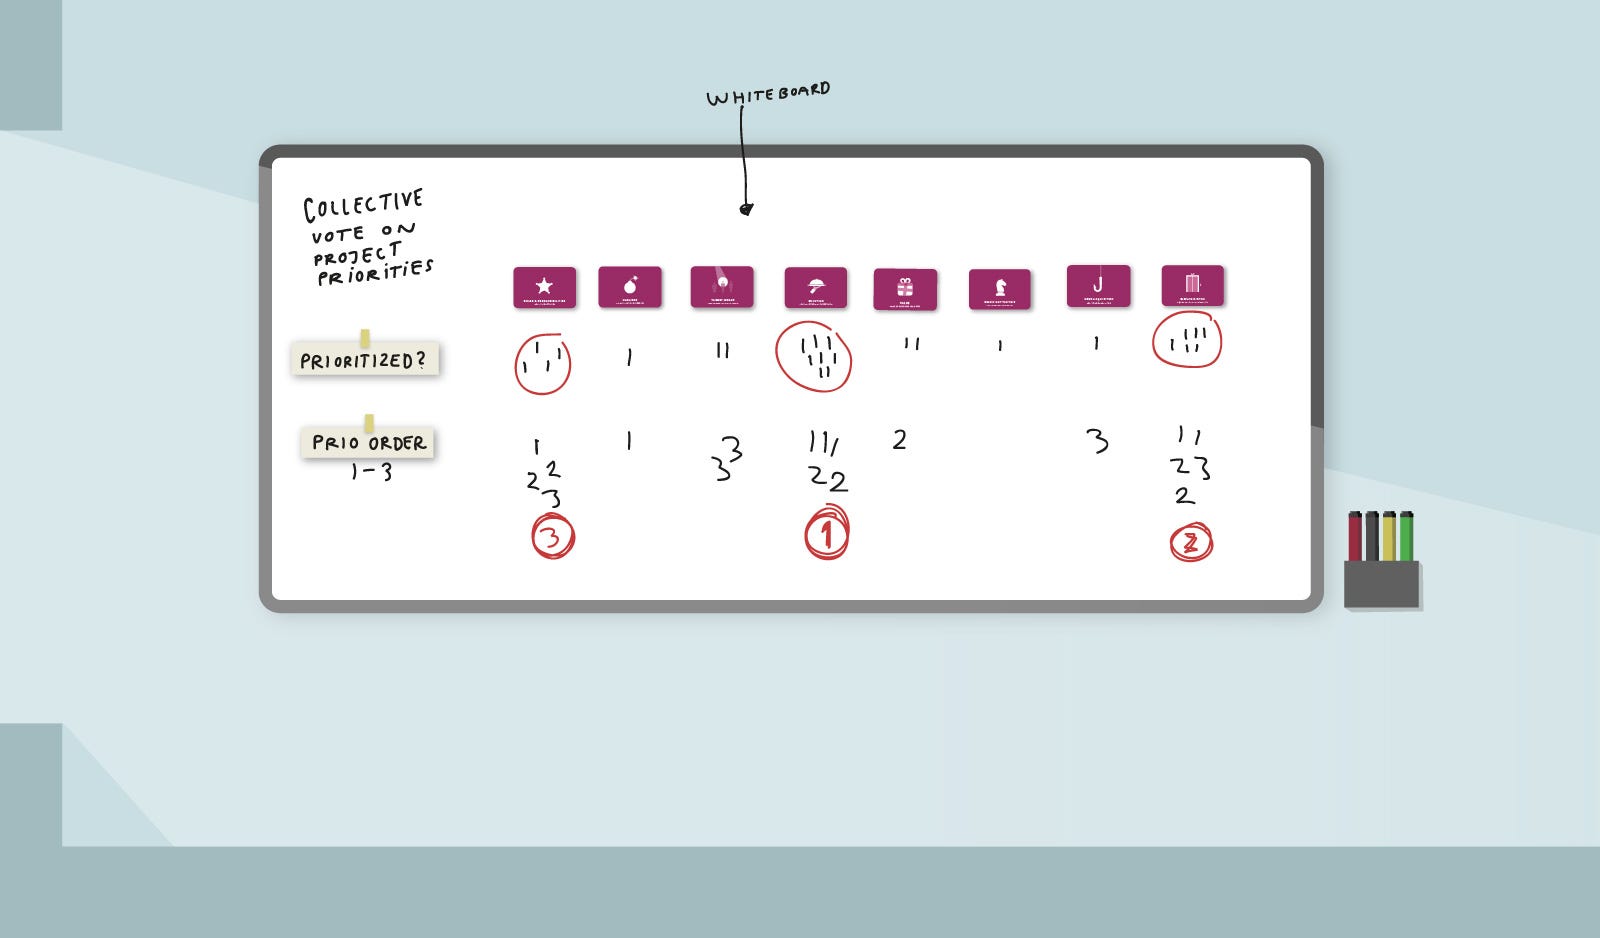
Vote on Whiteboard
Vote on which aspects are most important in the project at the moment.
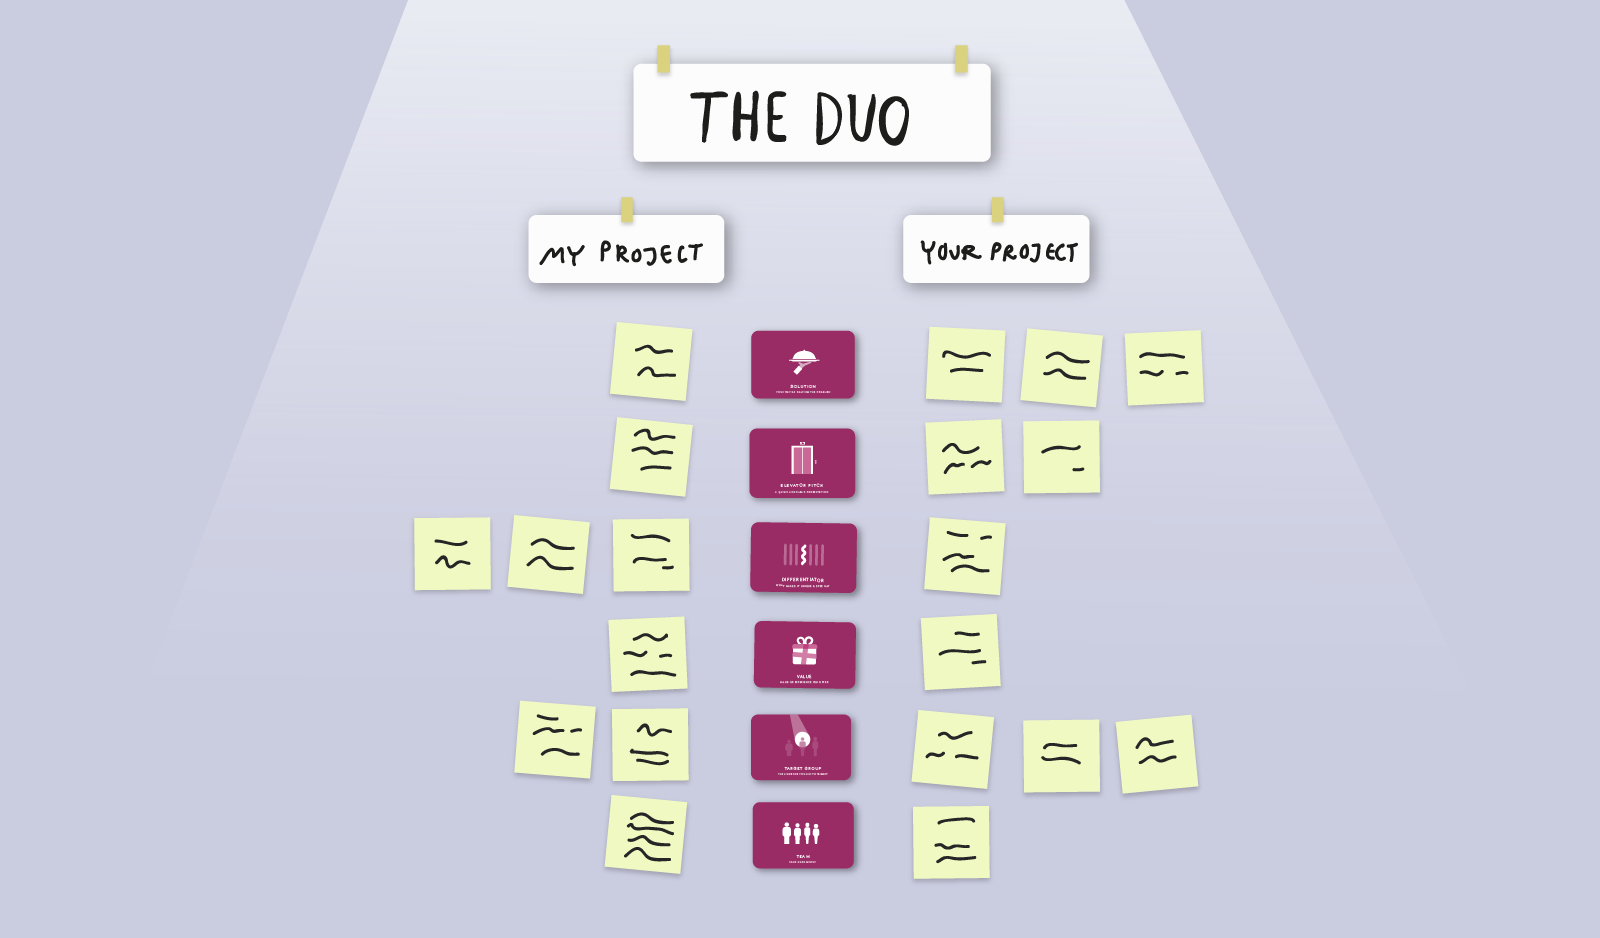
The Duo
Work side by side with a partner, helping each other to define your projects. Give and take valuable feedback and advance both projects simultaneously.

Using it as a structure in personal/professional coaching
We have used MethodKit for Personal Development to help people create personal mappings. We selected 10–15 cards. The person got one card at the time and spoke about themselves in relation to the card (for example goals, vision, fears, energizers, drainers, routines, employments etc).
While they were speaking we listened and asked follow-up questions to clarify. During the talk we wrote a few lines summarizing each card into a Google Doc. The person got their mappings to be able to continue themselves.
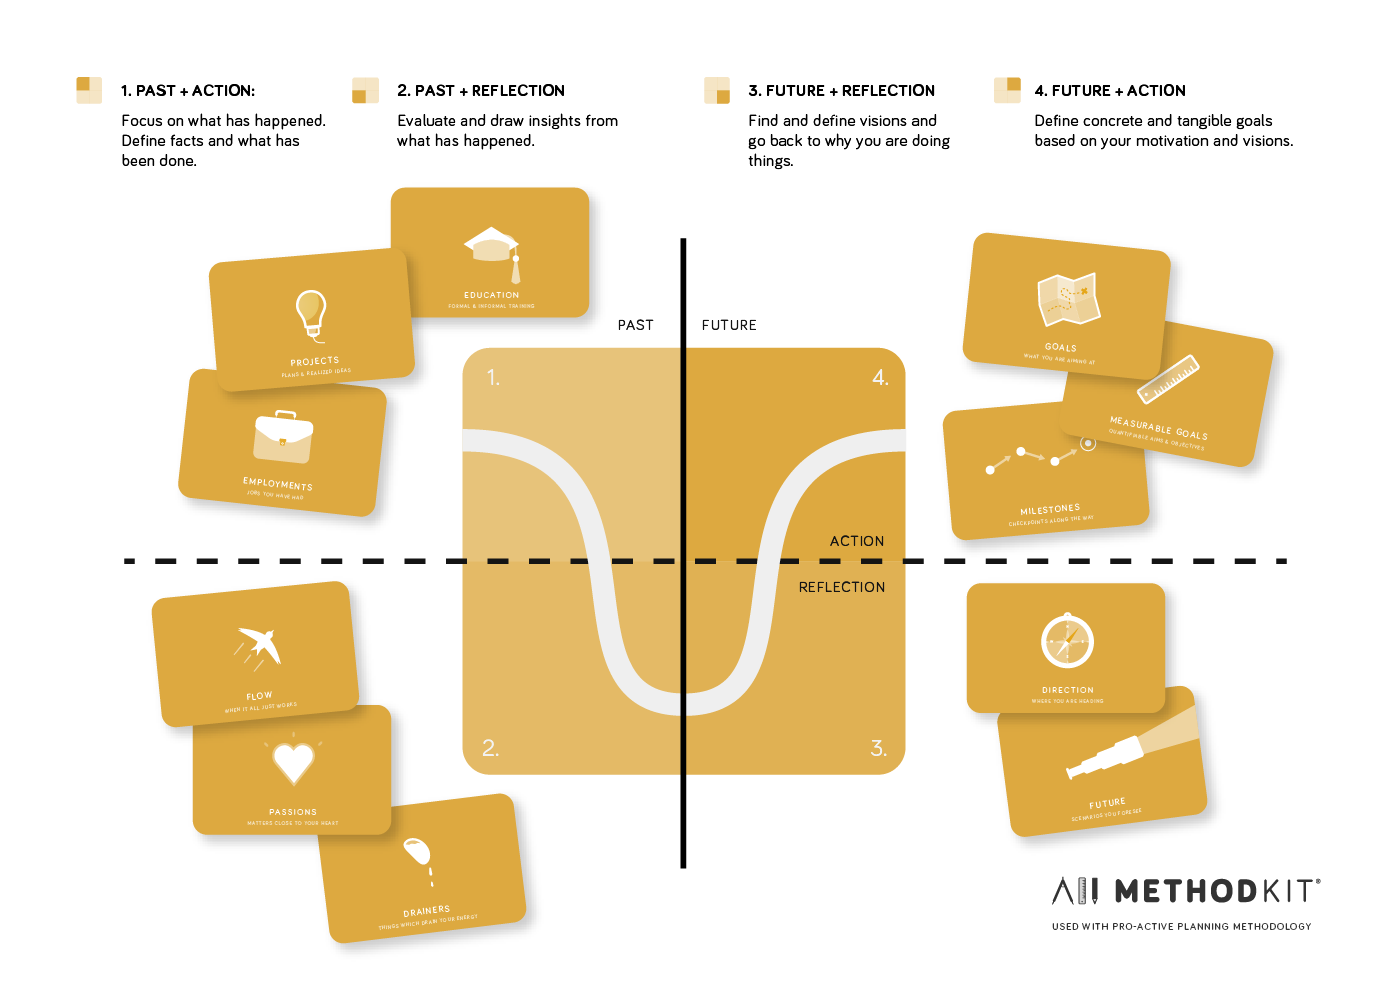
Using it with the pro-active planning methodology
In the example above we went from facts based cards (like employments and education) to more philosophical ones (such as drainers, energizers and passions). Then we discussed direction and future and finally we set milestones and measurable goals.